Visualising London’s buildings with 3D mapping
I recently discovered a JavaScript library called OSM Buildings which provides a 3D representation of buildings from Open Street Map (OSM) data on a 2D map. OSM Buildings doesn’t generate a complete 3D model but uses a clever shading technique to make buildings appear ‘3D’. OSM Buildings and can be used with either OpenLayers or the Leaflet JavaScript map API’s.
I was interested in whether OSM Buildings could be used to visualise non-OSM data, in particular the Geoinformation group’s UKMap product, to create a complete ‘3D’ city map. The UK map database is a commercial, attribute rich, map database designed to compete with the UK’s Ordnance Survey products, and contains a LiDAR derived height for most structures in urban areas. Furthermore, UK academics can access the UKMap data via the MIMAS Landmap service. As part of my PhD research I obtained a copy of the UKMap basemap and building heights for London from the Landmap team.
The OSM Buildings API provides a method to add a buildings layer from a GeoJSON object, so I wrote a simple Python CGI script to grab building features from the UKMap PostGIS database and return it as GeoJSON. The embedded SQL query (via the excellent Psycopg module) uses the new PostGIS 2.0 function ST_AsGeoJSON to return a JSON representation of the geometry. Unfortunately this isn’t as straight forward as it seems as PostGIS doesn’t return any feature attributes. However after reading this blog at the Postgres online journal and installing Andrew Dunstan’s backport of JSON support for PostgreSQL 9.1, I managed to get the query to return proper JSON representation of the attributes and geometry.
To reduce data volume (there are ~5 million features in the database) the CGI script accepts a bounding box parameter in well known text form, and only features within the bounding box are returned. Here’s a snippet showing the SQL query:
SELECT row_to_json(fc)
FROM (SELECT 'FeatureCollection' As type, array_to_json(array_agg(f)) As features
      FROM (SELECT 'Feature' As type,
            ST_AsGeoJSON(ST_Transform(lg.the_geom,4326))::json As geometry,
            row_to_json((SELECT l FROM (SELECT height) As l)) As properties
            FROM "3DLondon" As lg
            WHERE ST_Within(lg.the_geom,
            ST_Transform(ST_GeomFromText(%s,4326),27700))
            LIMIT 100000)
      As f )
As fc;',[bbox_wkt])
A sample of the features and their geometry returned as GeoJSON:
{"type":"FeatureCollection","features":[{"type":"Feature","geometry":{"type":"MultiPolygon","coordinates":[[[[-0.099928777847266,51.514483900172905],[-0.100343210931384,51.514457880418973],
//...
Thanks to some good documentation at OSM Buildings the front end is a simple JavaScript function to add the buildings to the map via a jQuery post AJAX call.
//Request data from GeoJson server and add to map
function getBuildings(bounds_wkt){
	jQuery.postJSON('/3DLondon/get_geojson.py?bbox_wkt='+bounds_wkt,
   function(data){
		build
     		.addTo(map)
	        .setStyle({ wallColor: 'rgb(200,190,180)', roofColor: 'null',
                        strokeRoofs: true })
     		.geoJSON(data)
		;
		});
};
Using this function it was fairly straightforward to add some functions to listen for Leaflet map events to refresh the building data when the map was moved or zoomed.
//Listen for map pan events and get new buildings data
map.on('moveend', function(e) {
   getBuildings(getBBoxWKT());
});
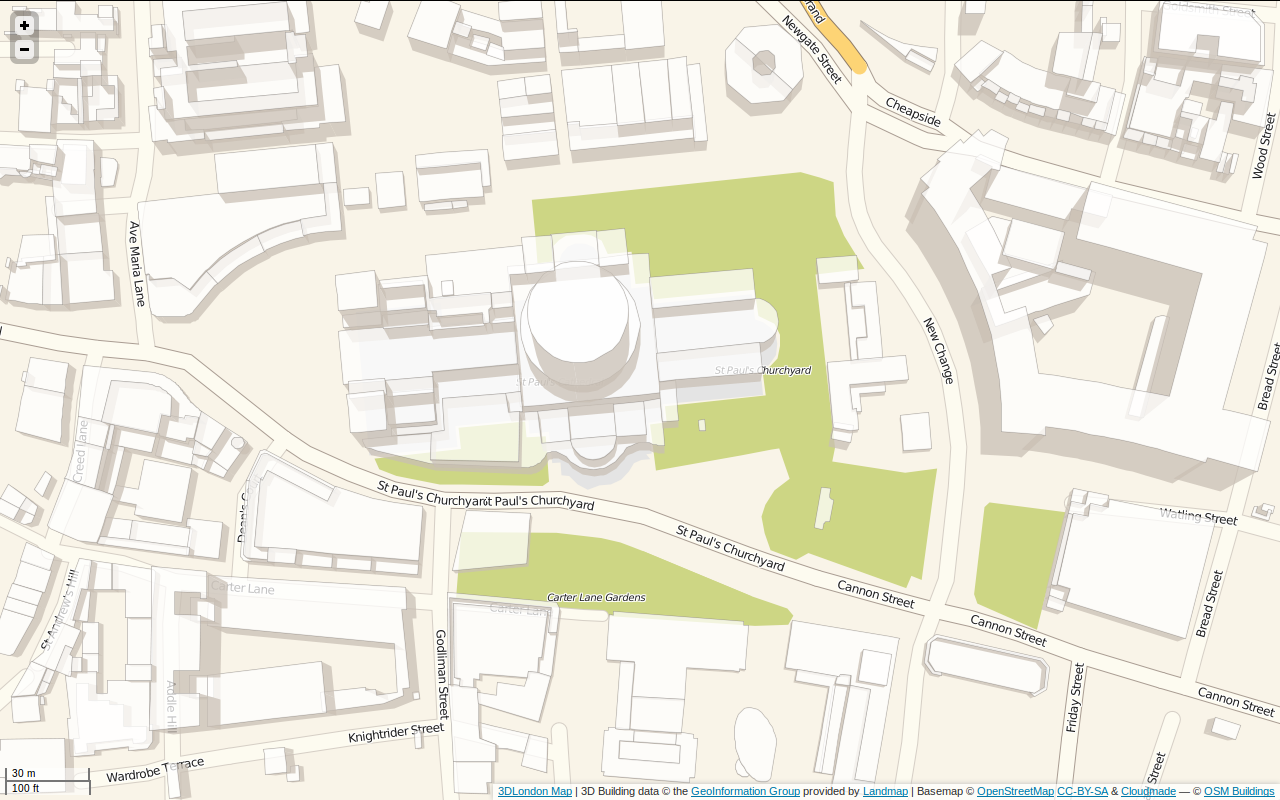
From the screenshot above you can see that OSM Buildings is doing a great job of rendering stuff in ‘3D’. The basemap is Open Street Map data, styled and served by CloudMade with OSM building footprints removed for clarity. In a nutshell I was pretty impressed with both the OSM Buildings and the Leaflet libraries. You can check out the complete source code at https://github.com/talltom/3DLondon, and here’s another screenshot over a larger area with the buildings rendered in blue.

3DLondon map of St Paul’s/The City and surrounds

[…] visualizar los edificios de Londres con mapeo 3D, un artículo de blog por Tom […]
Reallt cool, I’m guessing the first link should probably go to http://osmbuildings.org/
When I read the summary about this I was hoping for a library to take OSM shapes and get the height of them from lidar data. Oh well.. 🙂
Thanks for spotting the link typo, I’ve fixed it now! I think lots of buildings in OSM already have height attached, but haven’t looked into it so may be mistaken. Cheers.
[…] a simple land cover classification using the UKMap Basemap (which I previously used to generate the 3D London map). Click on the image below to see a larger version (1.8Mb at […]
[…] to visualize London’s buildings with 3D mapping, a blog post by Tom […]